Performance and loss analysis
Turn monitoring data into a clear loss tree. We compare measured generation with what the plant should have produced given the sun it received. The gap is broken into losses from soiling, shading, temperature, downtime, inverters, curtailment and degradation.
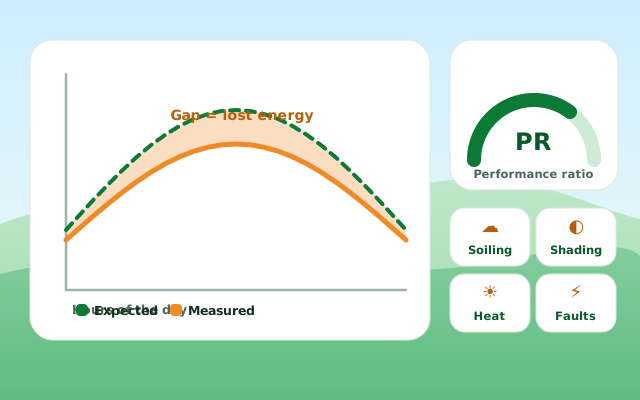
- Generation or performance ratio has slipped
- The O&M report says all is fine but income says otherwise
- You need a baseline before buying or refinancing
- You want to size a cleaning plan
- Shows where the energy is going before anyone opens a panel
- Makes the case for a site visit with evidence
- Helps compare plants on a fair basis
How we do it, step by step.
Collect SCADA exports, meter readings and irradiance records.
Remove bad data and align timestamps across systems.
Estimate expected generation from the irradiance and the plant design.
Allocate the gap to causes and point to the tests that will confirm them.
- A loss tree from expected to actual generation
- A short list of suspects to test on site
- Monitoring gaps you may want to fix
Outcomes depend on what the inspection finds. Possibilities are labelled as such in every report.
- Performance ratio and CUF trends
- Loss breakdown chart
- Recommended on-site tests
Instruments: Analysis tools and data-logger access
Two weak inverters found by tracking daily efficiency
After the weak inverters were replaced and a claim was made on the manufacturer, the plant gained about 1% in performance.
Read the case →Other services
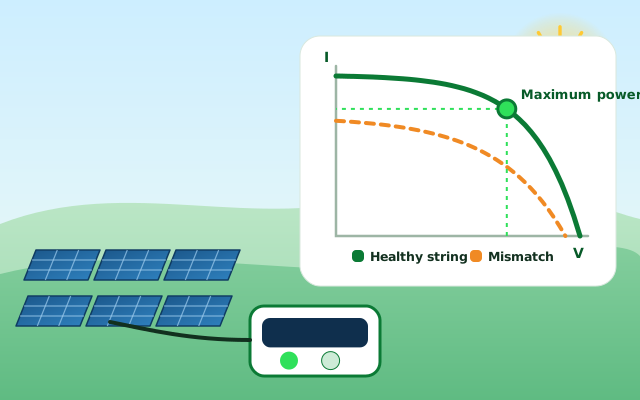
IV curve tracing
Measure what each string and module can really deliver.
See the process and outcomes →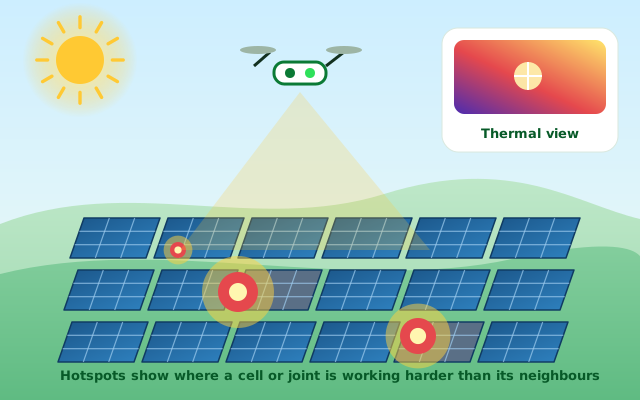
Thermography
See heat problems from the ground or from the air.
See the process and outcomes →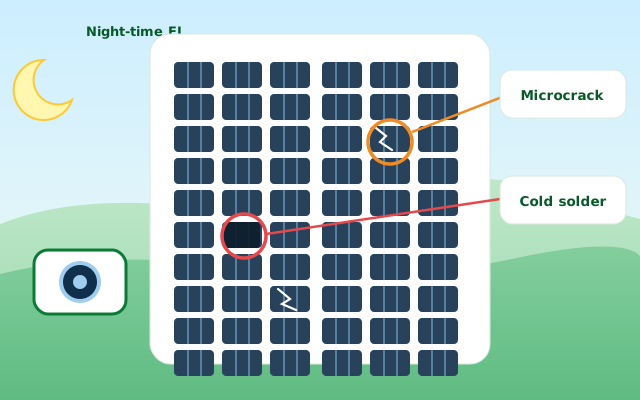
Electroluminescence (EL) imaging
Look inside cells for cracks and bad solder joints.
See the process and outcomes →Want this test on your plant?
Send an enquiry and we will prepare a checklist for your site.