9diagnostic services, each with a clear process
5steps from enquiry to analysis report
1engineer-led team, headed by Mr. Ramchander
Pan-Indiareach, through engineers and a technician network
When generation slips and the maintenance report still says “all fine”, Retron Solar Diagnostics tests the plant, finds the cause and shows you the evidence. Led by Mr. Ramchander.
A design report predicted the energy. A financing model counted the returns. Commissioning day ended with handshakes and a green light on the inverter.
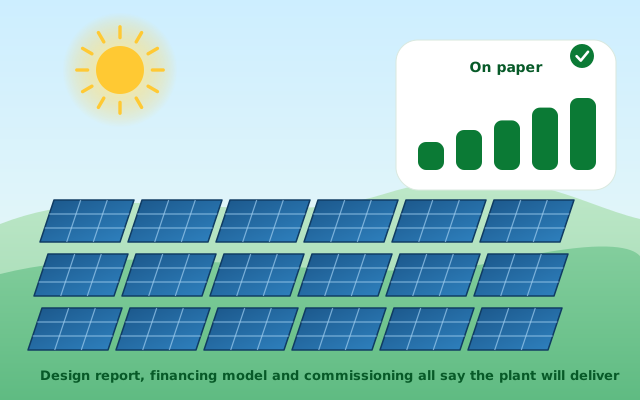
Nothing breaks. No alarm sounds. The units just come in a little lower, month after month, and nobody can say exactly why.
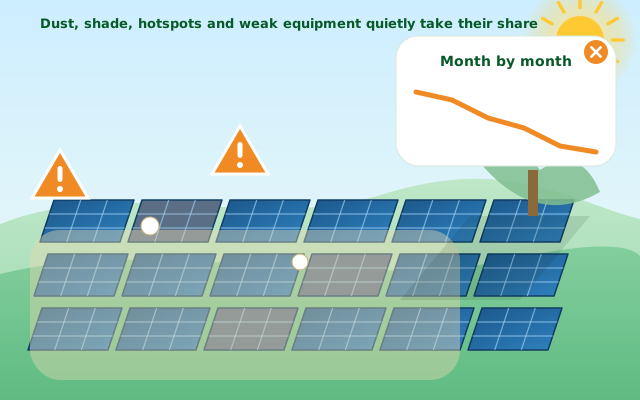
The monthly report shows cleaning done, plant available, security round complete. It rarely shows what each string, module and inverter is actually delivering.
The last two points reflect challenges listed by Renewable Watch in July 2019. The first two are typical patterns, not figures. Sources
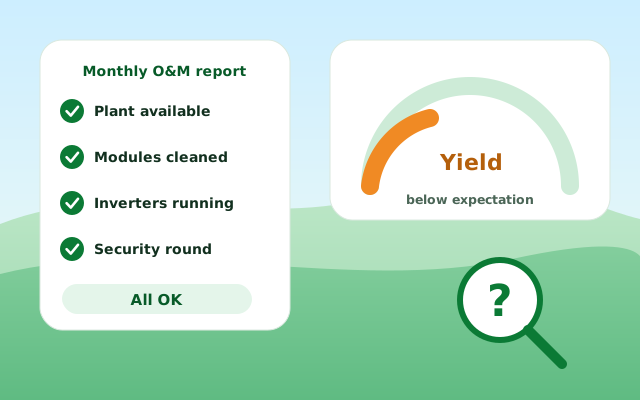
Which one sounds like your plant? Each one has a test that can explain it.
Monthly units are lower than the design estimate and lower than similar plants nearby.
Output swings with the cleaning calendar.
Discoloured cells or modules that run much hotter than neighbours.
Output loss with nothing visible on the glass.
Alarms in the afternoon, one inverter producing less than its twins.
Power falls year after year faster than expected.
Some strings carry noticeably less current.
Inverters stop with ground-fault warnings, especially after rain.
Reports show uptime and cleaning but not what each string delivers.
We measure the plant the way a doctor examines a patient: instruments first, opinions second. Every finding comes with the reading, the image or the log behind it.

Director – Technical at EV Retron Energies, Associate Professor at BVRIT, and 15+ years in solar PV design, audits and research. Every report is reviewed by his team before it reaches you.
See his portfolio →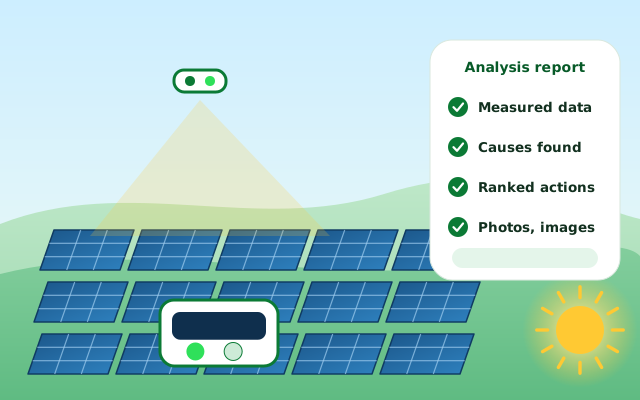
Tell us about the plant and the problem, by form, call or message.
Our engineers prepare a site-specific due diligence checklist from your enquiry.
A trained technician from our network visits with the instruments and the checklist.
Mr. Ramchander's team reviews the readings, images and logs in detail.
You receive a report with measured findings, causes, ranked actions and next steps.
Pick the service that fits your problem. Each page explains the process, the benefits and what you can expect to receive.
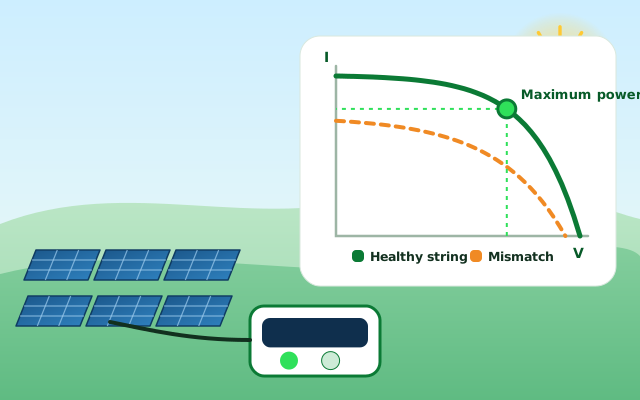
Measure what each string and module can really deliver.
See the process and outcomes →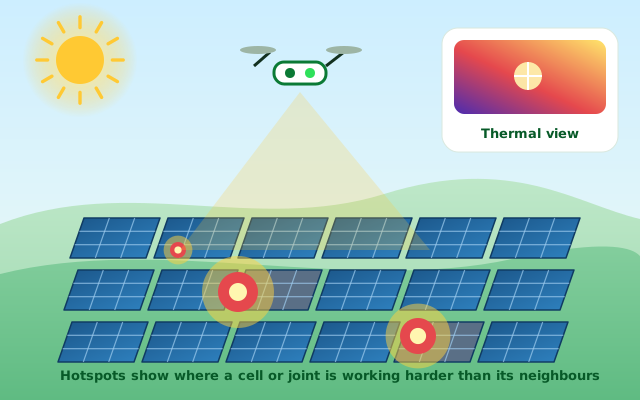
See heat problems from the ground or from the air.
See the process and outcomes →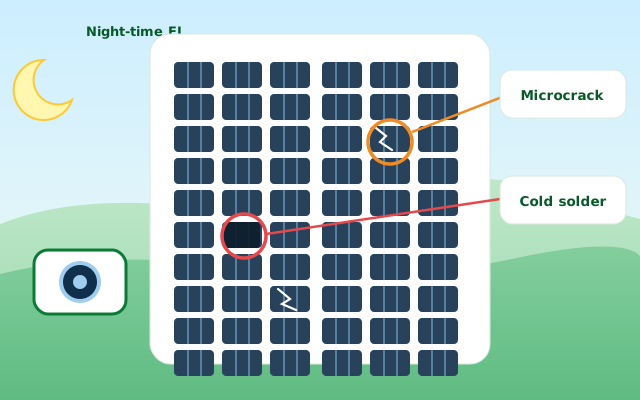
Look inside cells for cracks and bad solder joints.
See the process and outcomes →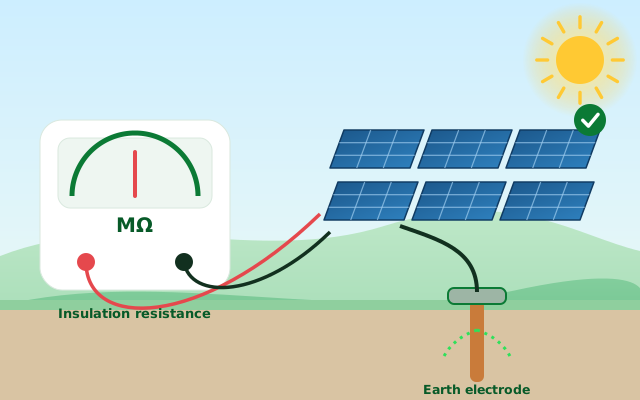
Check the plant is safe, and leaking no energy to ground.
See the process and outcomes →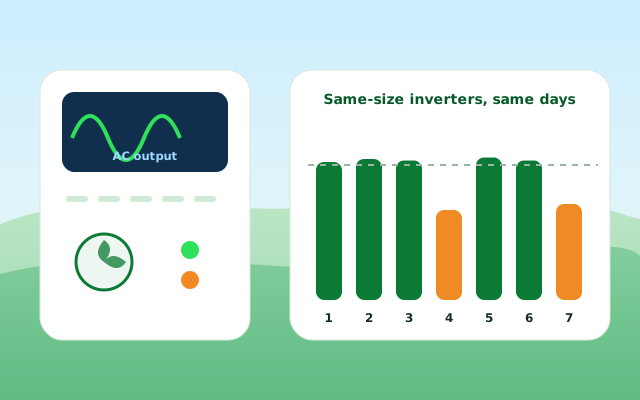
Find the weak inverter before it costs another season.
See the process and outcomes →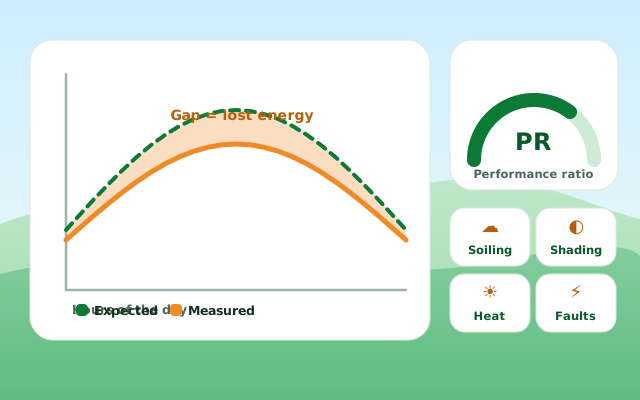
Turn monitoring data into a clear loss tree.
See the process and outcomes →Our own case studies will lead this section. Until then, here are industry references, credited and summarised in our own words.
Clean Energy Associates (CEA)
Read the case →Saur Energy article on solar diagnostics
Read the case →Saur Energy article on solar diagnostics
Read the case →CSTEP, “PV Reliability” techno-economic simulation study, April 2018 (simulated 1 MWp plant, not a field survey) · Renewable Watch, “Optimising solar”, July 2019 · Renewable Watch, “Soiling analysis”, December 2018.
We have not independently verified these sources. Findings on this site are possibilities until a site inspection confirms them.
Tell us about it. We will prepare a checklist and a plan.